Excel: multiple lines for one record and merged cells

Hello,

I am checking Qalyptus for a QlikSense installation at a customer.

There are two questions at the moment:

  1. How can I put the table data into multiple rows in Excel?

Table structure looks like this:
±-------------------±-------------------±-------------------±-------------------+
Field 1 Field 2 Field 3 Field 4
±-------------------±-------------------±-------------------±-------------------+

In Excel I would like to create the output like this:

±-------------------±-------------------+
Field 1 Field 3
±-------------------±-------------------+
Field 2 Field 4
±-------------------±-------------------+

  1. Can I merge cells to get this result?

±-------------------±-------------------±-------------------+
Field 1 Field 3
Field 0 ±-------------------±-------------------+
Field 2 Field 4
±-------------------±-------------------±-------------------+

Feedback is very welcome!

Thanks

Niko
Hi @kern,
Welcome to the Qalyptus community.

  1. How can I put the table data into multiple rows in Excel?

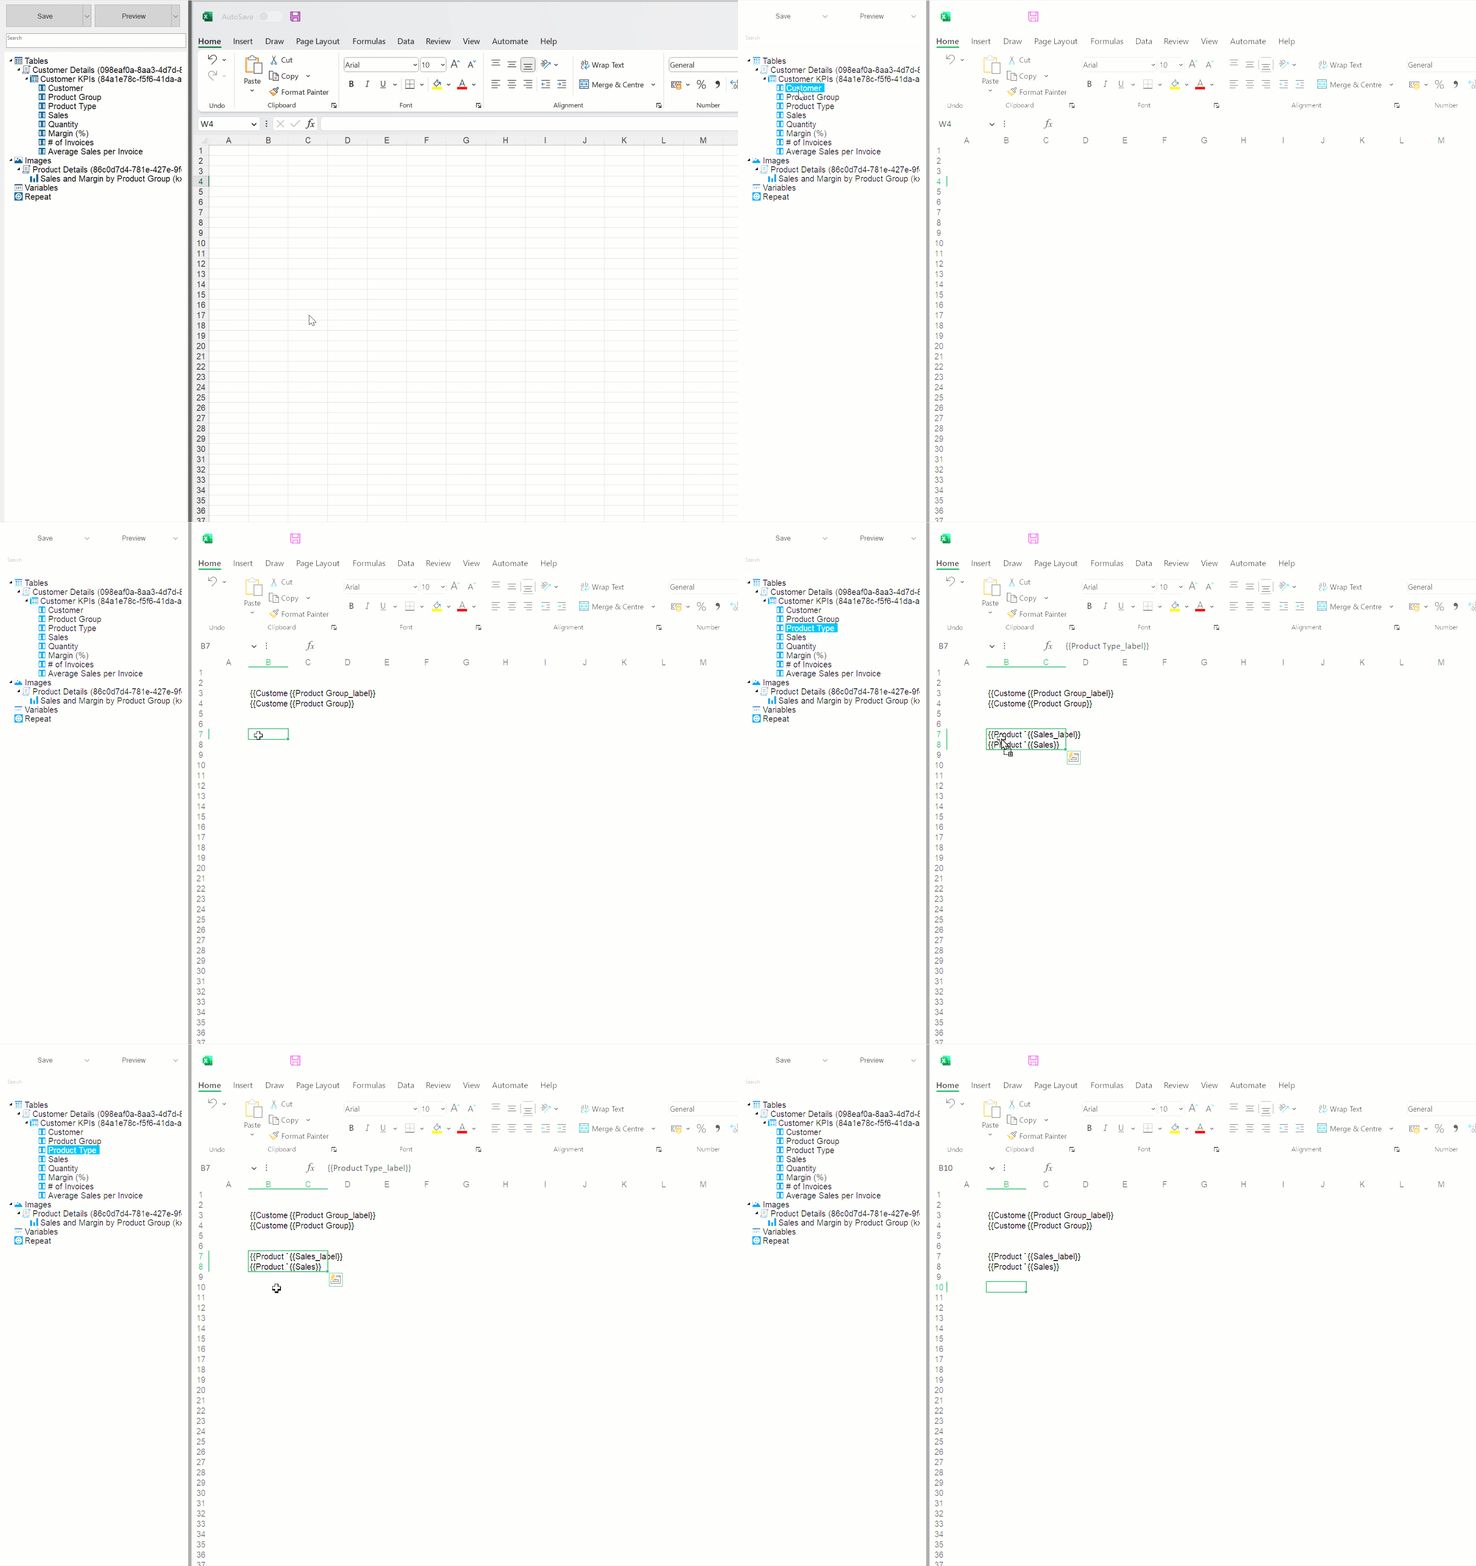
Drag and drop the columns Field 1 Field 2 to a row, then Drag and drop the columns to the next row. See below
Drag-drop-columns

  1. Can I merge cells to get this result?
    You can mere header cells but not data cells

Let me know if this answer your questions or if you need more help

Thanks
Jeremie

Hello Jeremie,

I am looking for this kind of scenario: One record has multiple fields eg. tel and fax. I would like to put them - per record - below each other.

Let me know what you think about it.

Thanks

Niko

@kern,
I think a good option is to create a Pivot table in Qlik Sense, then use the Pivot table with Qalyptus.
Qlik Sense (Script + expressions) gives you more flexibility to achieve your scenario.

What do you think

Thanks
Jeremie